Weekly or daily reports of what services are needed for all your current occupied rooms. Click on the service report button and choose either weekly or daily report.
MotelMate can generate many types of reports including finance and guest statistics as well as day to day reports such as the diary and service tasks.
![]()
Weekly or daily reports of what services are needed for all your current occupied
rooms. Click on the service report button and choose either weekly or daily
report.
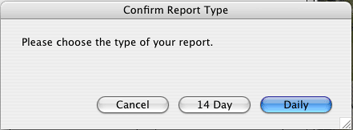
Enter the date you wish the report to be for.
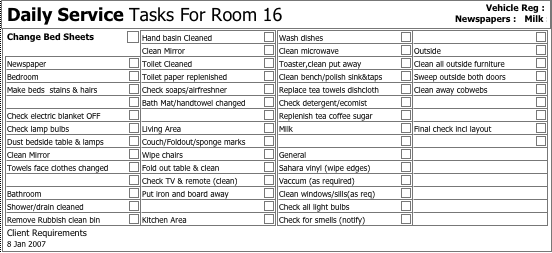
The daily report will print out individual cards
for each room such as the one below.
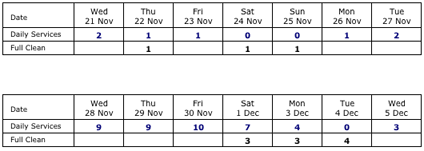
The weekly service report will simply provide a total
of what services are required in total each day . This can be used for staff
management.
![]()
A quick reference to all today’s check ins and outs listed in report format.

![]()
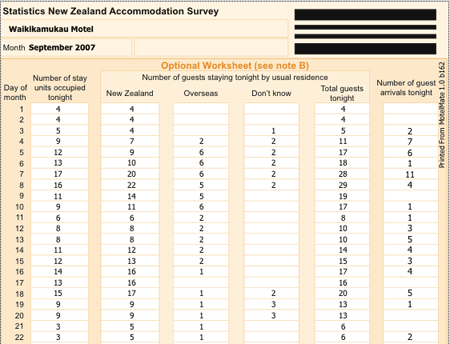
Your annual accommodation survey will fill out for you automatically. This is
required by the government's statistics department and can be printed straight
off MotelMate for submission.
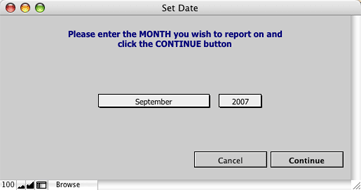
Enter the month you wish to report for and then Continue.
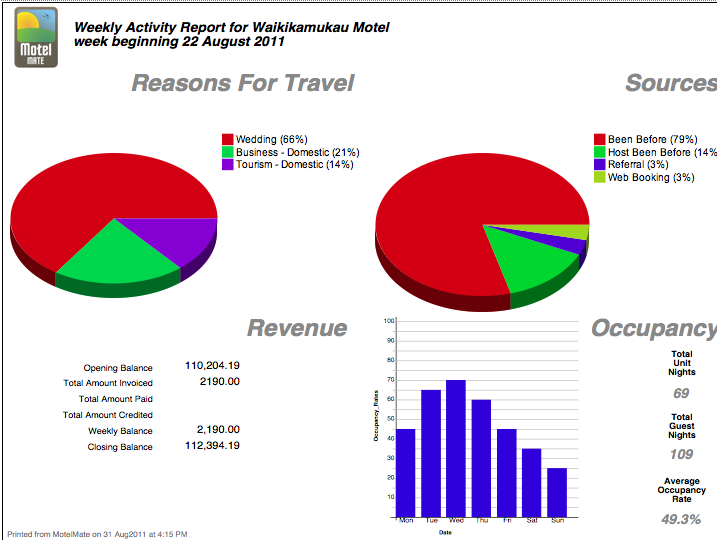
The Weekly Occupancy Report offers
a graphical report of revenue and occupancy levels over the course of a selected
week.
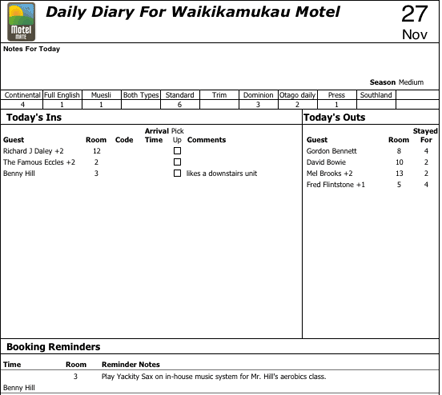
The diary sheet is a summary of all the day's ins and outs, as
well as total orders for daily items such as newspapers, breakfasts and milk.
It also has any events which are added to the guest's individual
booking record.
![]()
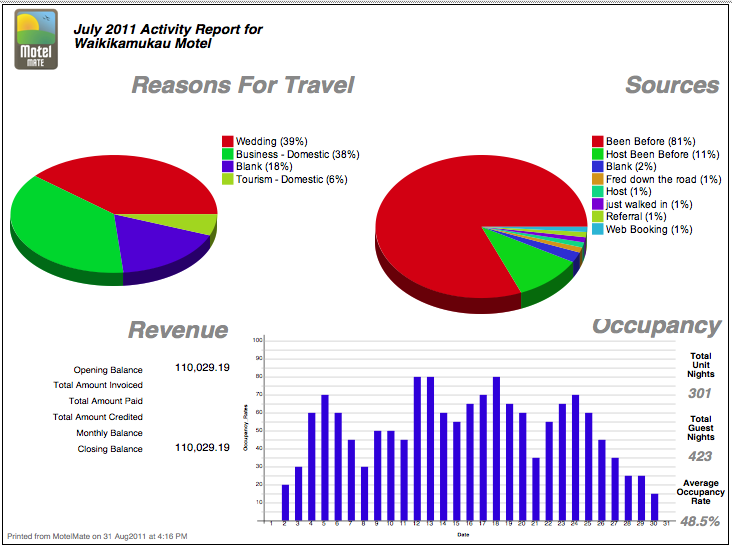
The Monthly Occupancy Report offers a graphical report of revenue
and occupancy levels over the course of a selected month.
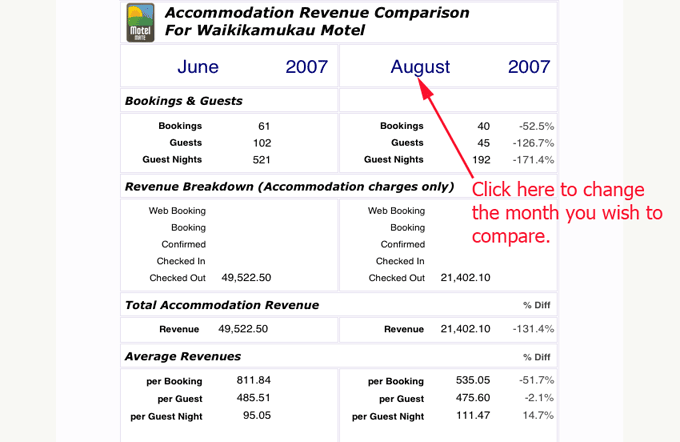
The Revenue Comparison can offer a listing of
booking statistics and revenues for two selected months side by side.
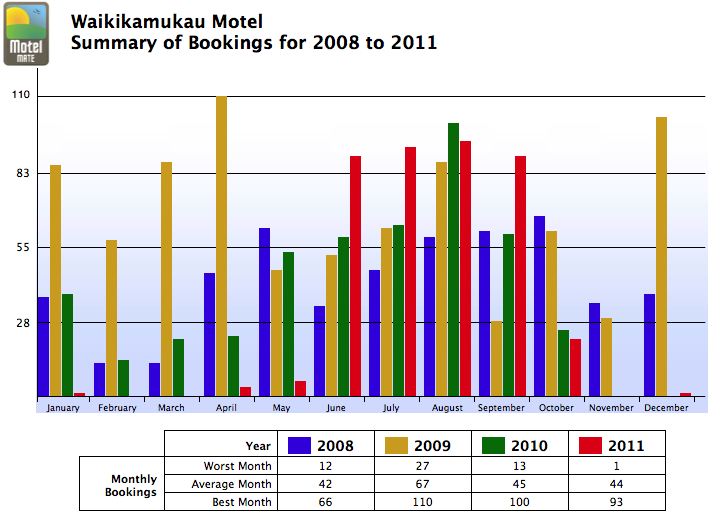
Yearly reports can be generated comparing statistics from the
last three years. By clicking on the drop down list in the top right hand corner
you can change the report from guest and booking data to income.
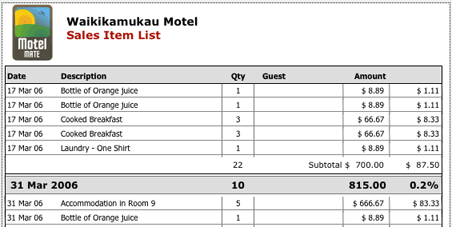
The sales item list offers a listing of individual line items
that appear on clients' invoices. The list can be created like other lists by
performing a 'find' and then sorting the data to get the report that you need.
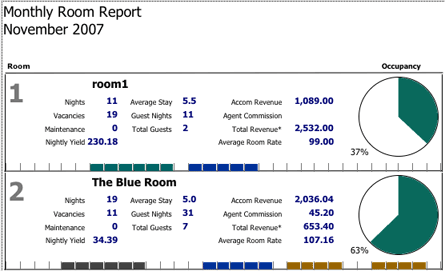
Statistics for each individual room can be displayed as the report below including a pie chart indicating the room's occupancy rate. Click on the month scroll bar over to the right to report for a different month.
![]()
The Sales Item analysis is similar to the Sales Item list in that it deals with all saleable items including your accomodation charges, agent reimbursments and all other sundry items. However the analysis can offer for you to use another category such as supplier, category or date as a point of reference as opposed to the individual line items themselves.
For example a sales item list looks like this.

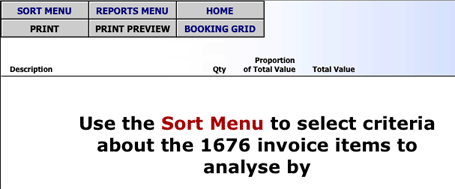
If you choose sales item analysis instead you will be promted to sort the data which you have selected (by choosing Find or Current data).
 |
 |
|
| Select from one of the above sort categories. For example supplier. |
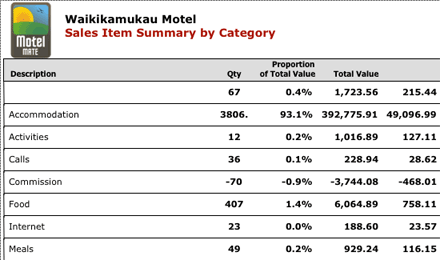
The resulting list will similar to the one below. Notice how the selected sort order becomes the focus for the report that is the sort criteria is in the first column and a summary of the data is listed alongside.
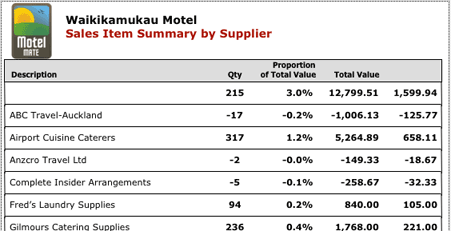
The following list was sorted by category.
